Monitoring system resource usage and statistics on Ubuntu
Basically, i'm looking for answers to these:
- Why did the server go down?
- What process was taking so many resources that the server crashed?
CPU utilization history and logs with System Activity Reporter (SAR)
The sar command can give you CPU utilization history. It's a part of a software bundle called sysstat which you'll need to install on Debian/Ubuntu
code
# install
sudo apt install -y sysstat

# enable data collection
# Set ENABLED="true" in "/etc/default/sysstat"
sudo sed -i 's/ENABLED="false"/ENABLED="true"/g' /etc/default/sysstat

# change the collection interval from every 10 minutes to every 2 minutes.
sudo sed -i 's/5-55\/10/*\/2/g' /etc/cron.d/sysstat

# restart sysstat for the change to take effect and data collection to start working
sudo service sysstat restart


# check cpu utilization
sar
The logs are saved in /var/log/sa/
By default only activity of last 7 days are saved, to change it, please check:
code
/etc/sysconfig/sysstat
To check for example yesterday (05 October):
code
sar -P ALL -f /var/log/sa/sa05
You can script the above for configuring all new Ubuntu machines to have sysstat from the get go
code
sudo apt-get install sysstat -y
sudo sed -i 's/ENABLED="false"/ENABLED="true"/g' /etc/default/sysstat
sudo sed -i 's/5-55\/10/*\/2/g' /etc/cron.d/sysstat
sudo service sysstat restart
Real-time CPU and memory usage
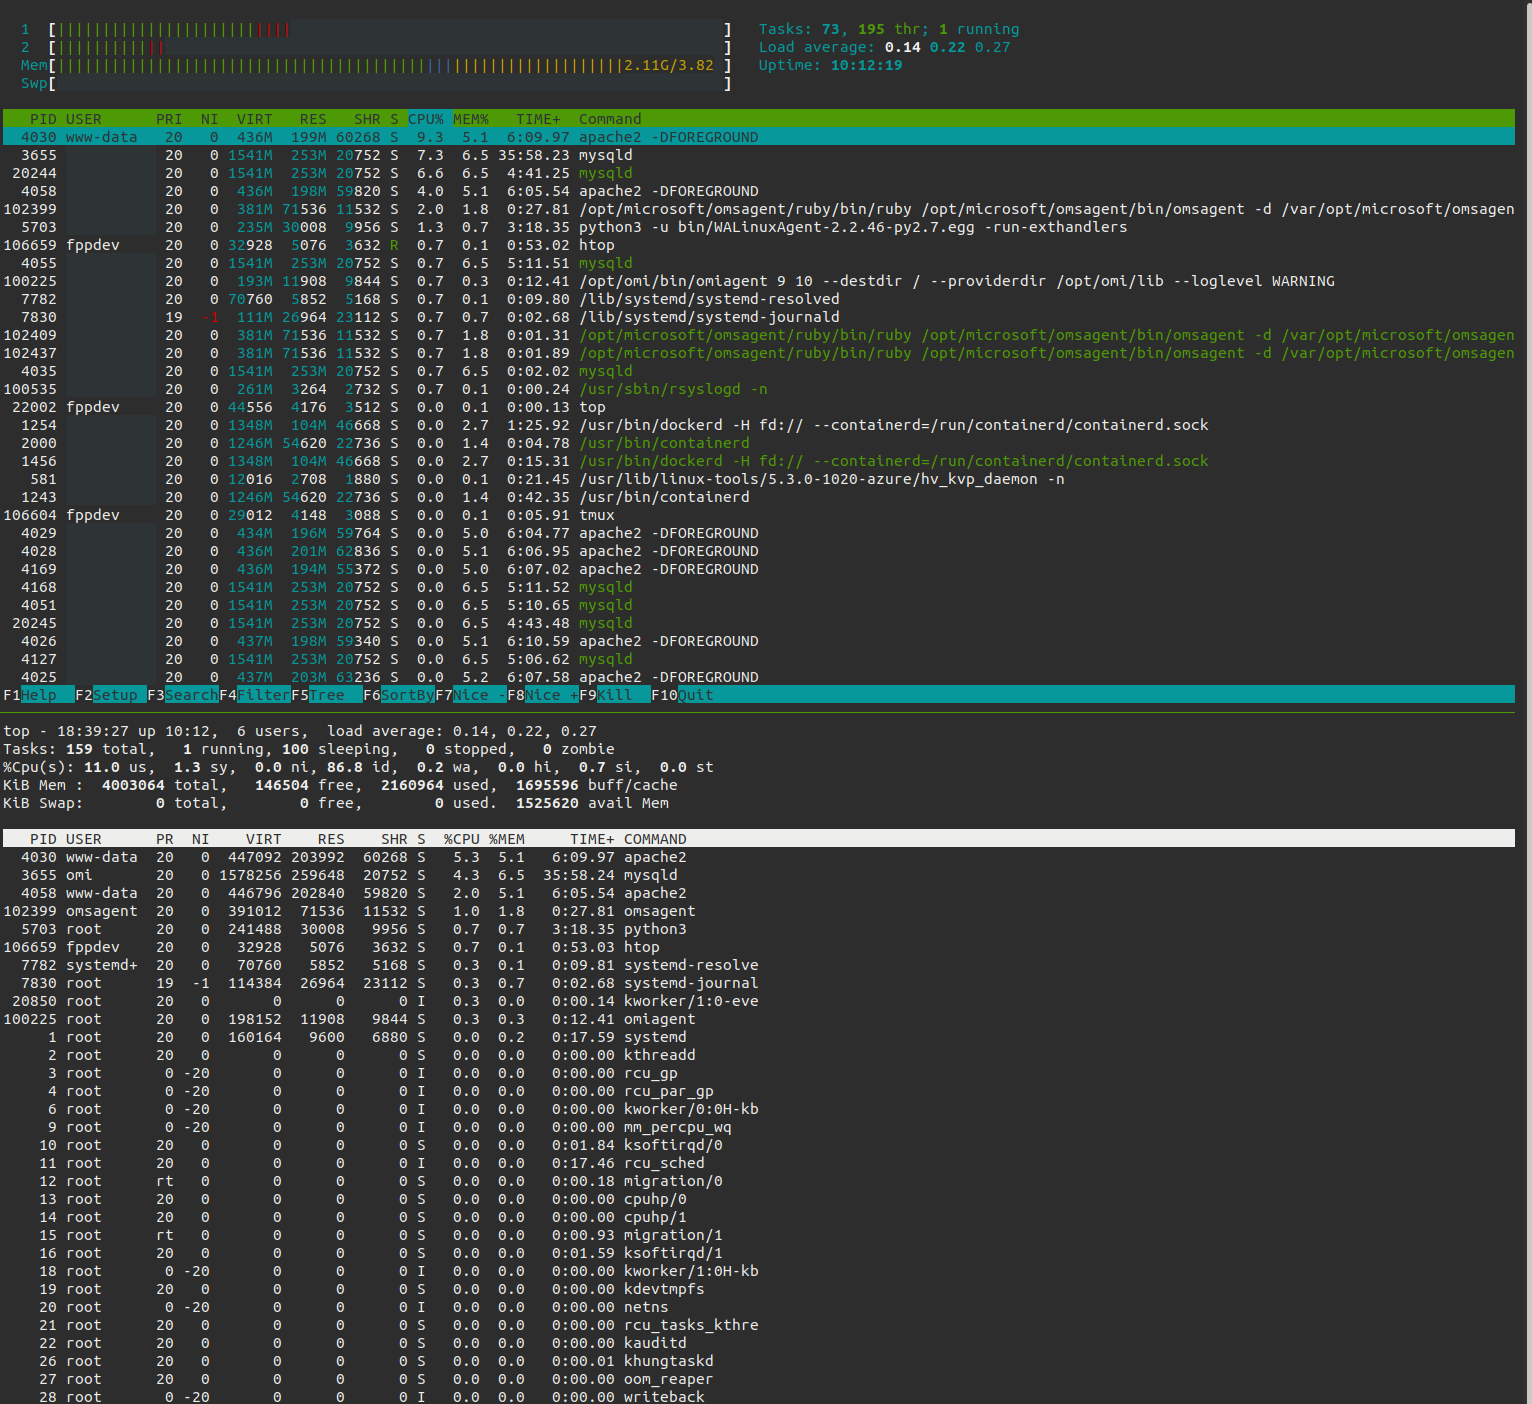
htopandtop.htopis definitely an improvement overtop